June 24, 2026
SmartThings Safe Premium is powered by Arlo, a third-party partner that operates the professional monitoring center and coordinates emergency dispatch on our behalf.
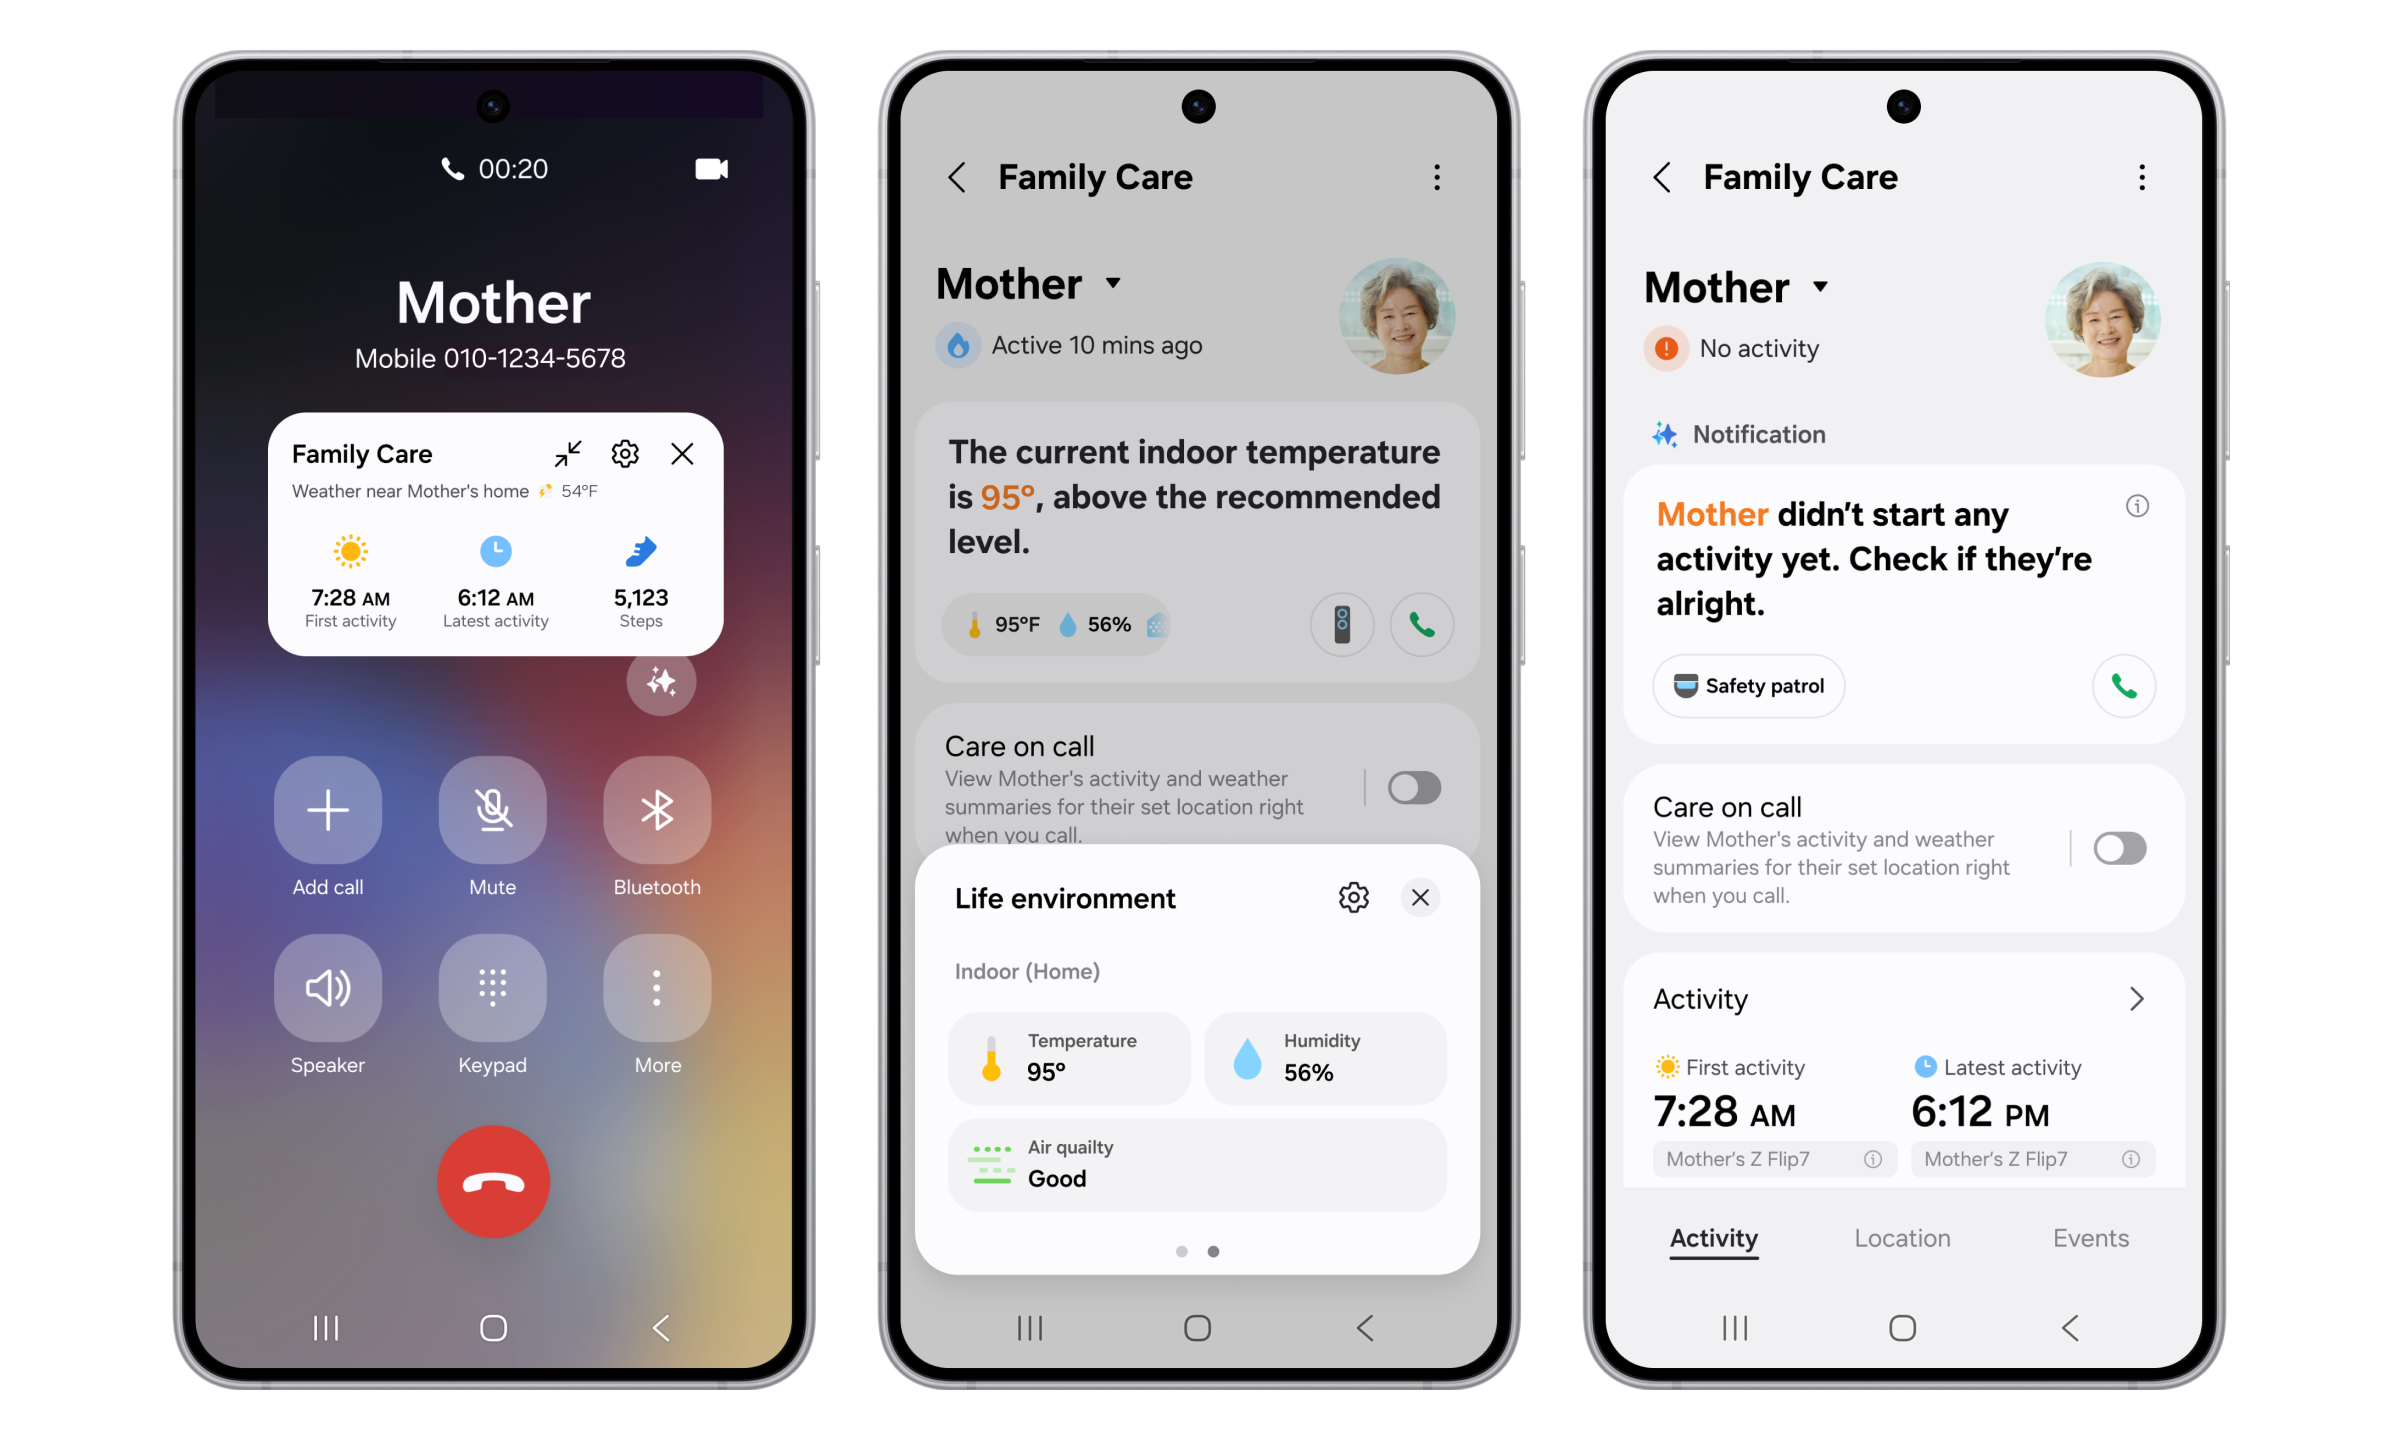
Feeling safe, whether at home or on the go, shouldn’t take more than a tap. With SmartThings Safe Premium, users can instantly send help requests, from inside the SmartThings app, to Arlo-powered emergency response providers who can send police, fire, or medical help to their exact location.
SmartThings Safe includes a Basic plan at no cost; the Premium plan adds 24/7 professional emergency dispatch through Arlo.
How It Works
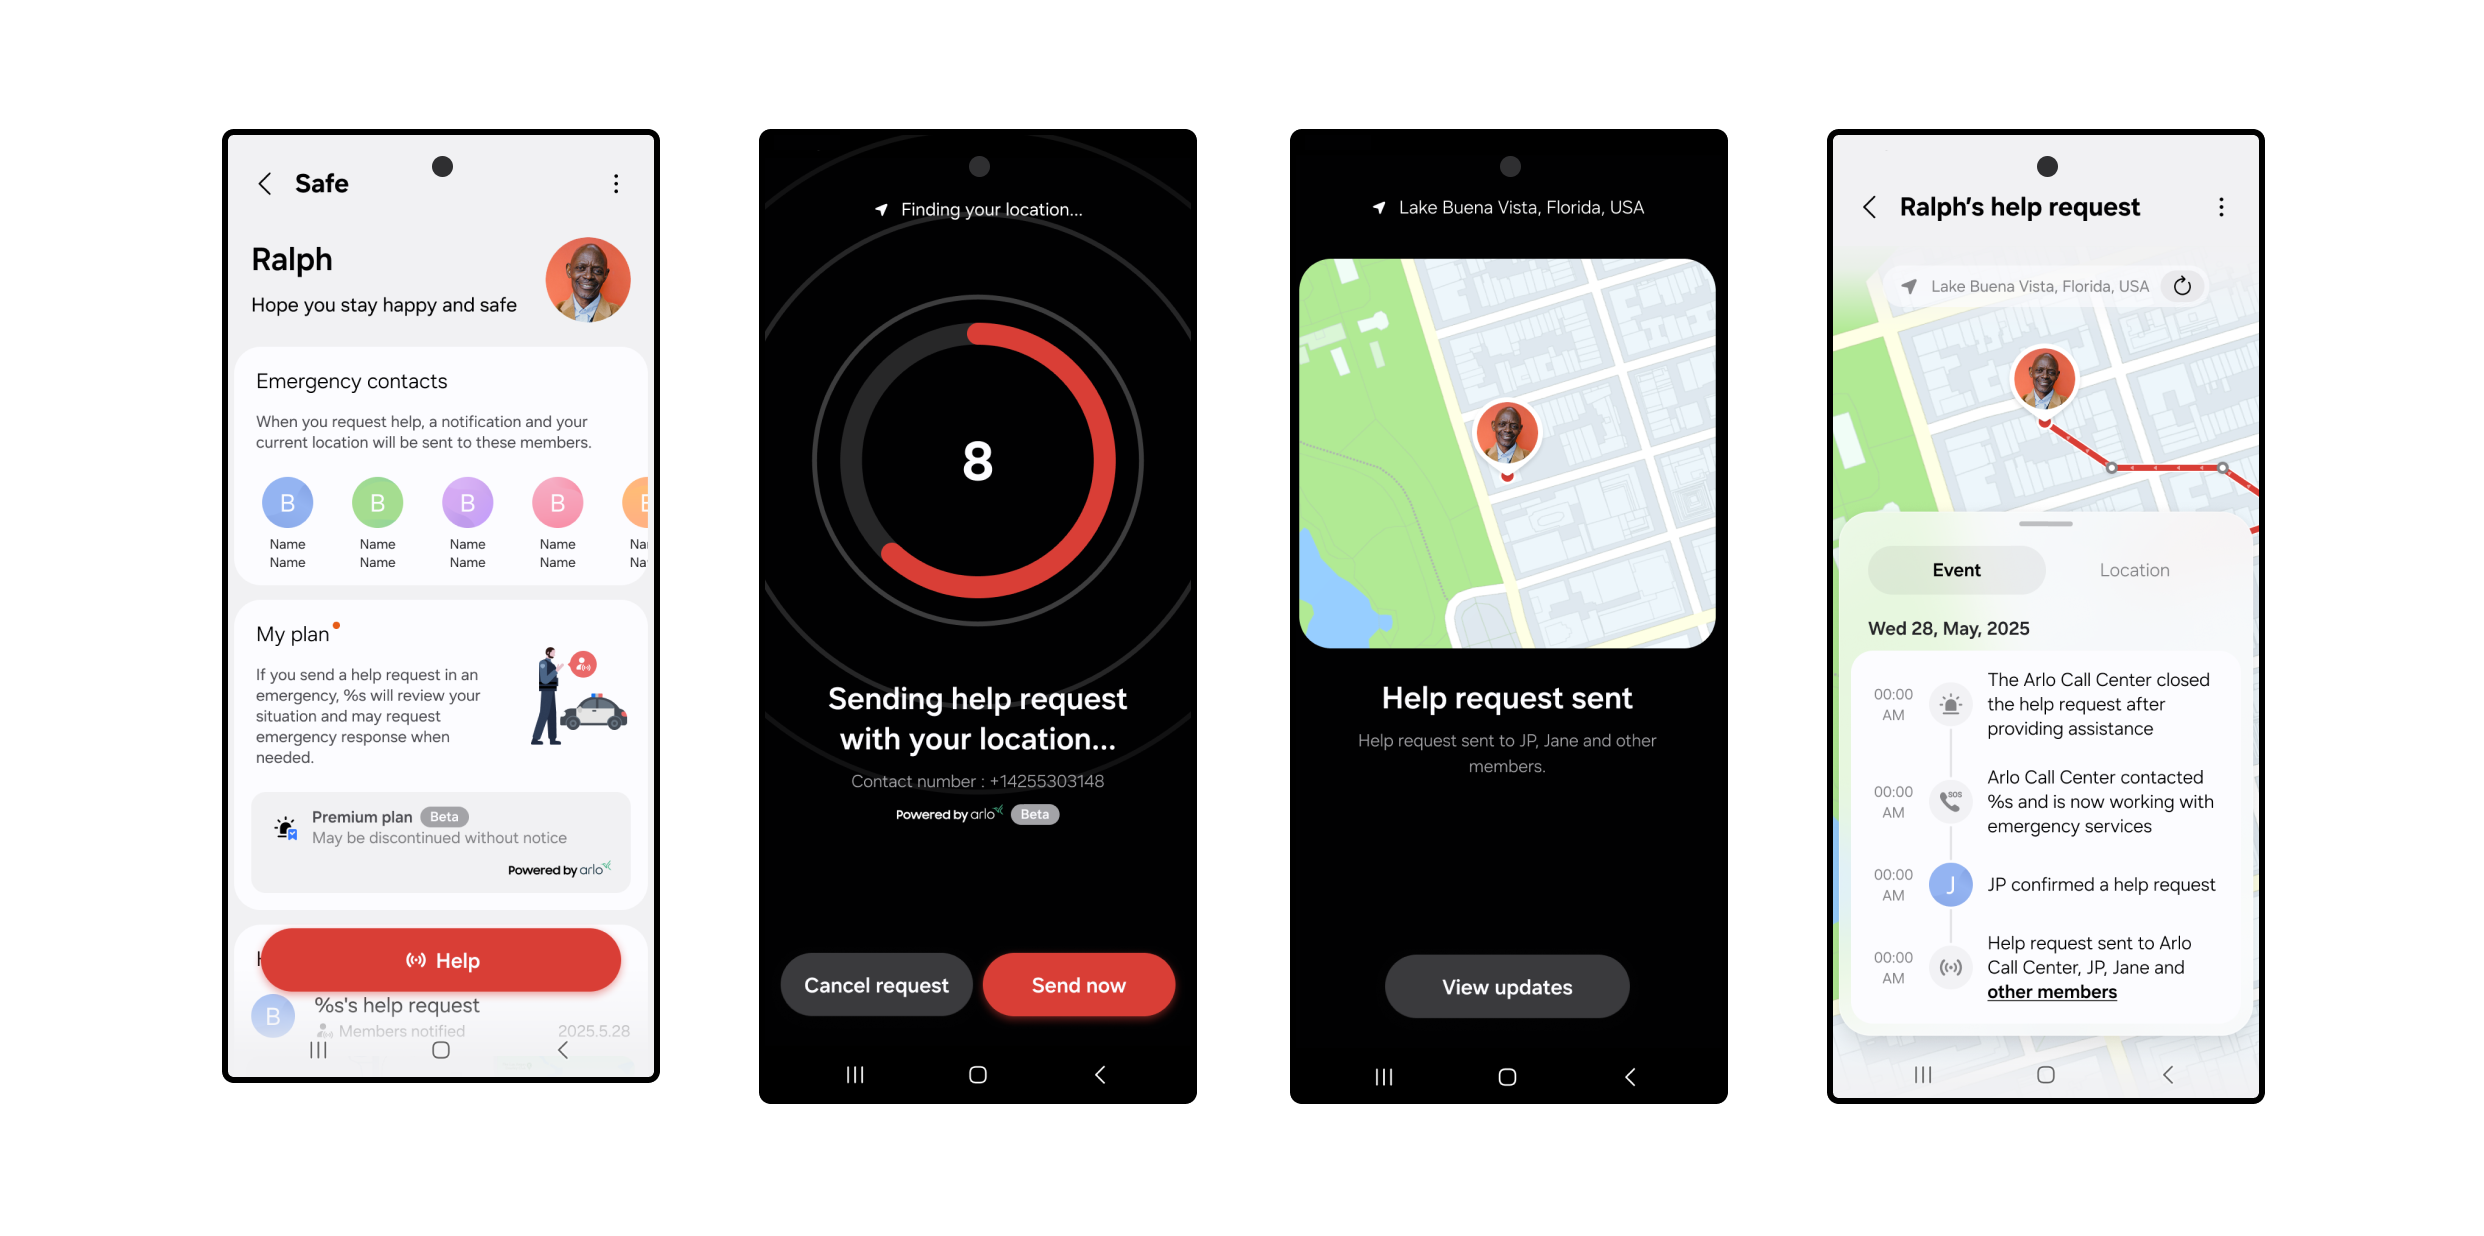
When you press the Safe button, a 10-second countdown starts. After 10 seconds, a help request is automatically sent to a professional monitoring center.
An Arlo monitoring agent will immediately call and text you to confirm what type of help (fire, police, or medical) is needed.
If they can’t reach you, they’ll request that local emergency responders (police by default) be dispatched to your current GPS location.
At the same time, just like the basic plan, your Location Members will receive a push notification with a map of your location and options to call or text you directly.
You can cancel your request at any time during the 10-second countdown. Once the alert is created, you can still cancel the request by responding to the monitoring center’s call or text.
Setting Up SmartThings Safe Premium
Getting started takes just a few steps:
Open the SmartThings app on your mobile device.
Tap the Menu icon at the bottom right of the SmartThings app.
Select Safe and complete setup, including agreeing to the terms agreement and completing identity verification.
Go to My Plan and select Upgrade to Premium Plan.
Follow the Samsung Checkout steps to activate your limited-time free access to SmartThings Safe Premium.
Once activated, you’ll see your Safe button appear in the app, ready whenever you need it.
Share alerts with the people who matter. Add family or friends to any SmartThings location — home, office, wherever — and they'll stay in the loop automatically.
From the Home tab, tap the three-dot menu in the upper-right corner.
Select Location Settings > Invite Members.
Enter the Samsung account email addresses of the people you want to add.
Added members will need the following to receive Safe alerts:
Have the SmartThings app downloaded.
Set up their own Samsung account.
Tap the Menu icon at the bottom right of the SmartThings app.
Tap the Safe icon and follow the prompts to get started.
Review and agree to the Terms & Conditions and complete two-factor authentication.
Have notifications turned on to receive Safe alerts.
These members will then become emergency contacts for dispatchers and the monitoring center.
For even faster access, you can add the Safe button to your Galaxy home screen or Quick Panel by selecting Settings > Add to Home Screen from the device card.
Make Sure Location Services Are On
To share your real-time GPS location with the monitoring center and your added members using the Safe Premium plan, you’ll need to enable Location Services on your phone.
On Galaxy and Android devices: Go to Settings > Location > App permissions > SmartThings > Allow all the time.
On iOS: Go to Settings > Privacy & Security > Location Services > SmartThings > Always and turn on Precise Location.
Safe Premium is designed to work when your mobile device has a signal. The service is currently available in the U.S. for supported Galaxy, Android, and iOS devices. Both the Basic and Premium plans of SmartThings Safe are designed for manual, user-triggered help requests, making them a great complement to built-in SOS features on smartphones. While Safe Premium does not currently support automations, routines, or smartwatch-triggered requests, users can receive Safe notifications on Galaxy Watches and Apple Watches.
Whether you’re checking in with loved ones or reaching out for help, SmartThings makes it simple to stay safe, connected, and in control.
Activate your *limited-time free access to SmartThings Safe Premium in the SmartThings app today.
*SmartThings Safe Premium is currently available as a beta service. Free access may be changed or discontinued without notice.